We often say that you can’t fix a problem you don’t understand. Today, Microsoft is releasing a new Digital Equity Data Dashboard to help create better understanding of the economic opportunity gaps in towns, cities and neighborhoods across the United States. The new tool was developed by our Chief Data Science Officer Juan Lavista Ferres and the Microsoft AI for Good Lab, and aggregates public data from the Census Bureau, Federal Communications Commission (FCC), BroadbandNow and Microsoft’s own Broadband Usage Data. It goes census tract-by-census tract, examining 20 different indicators of digital equity – such as broadband access, usage, education and poverty rates – to create one of the most complete pictures of digital equity in these areas to date.
Digital equity – access to affordable internet, affordable devices and digital skills – is a foundation for empowerment, digital transformation and economic opportunity. With states looking to drive historic investments in digital opportunity thanks to the Broadband Equity, Access and Deployment Program, the Digital Equity Act and more, it’s clear we can no longer just consider the immediate lens of broadband availability as a major indicator of opportunity. The pandemic made clear that being digitally connected – either through broadband or mobile internet – is a fundamental necessity for every citizen, and not just for school and work. The last two years has acted as an accelerant, driving essential activities online, from everyday businesses and services, such as banking and telehealth, to simply ordering food at a restaurant.
The dashboard was created with the best data possible as a resource to assist policymakers in identifying key places and communities within their state so they can direct funding and programmatic investments. Take Ferry County, Washington, for example, where the FCC claims that only 0.4% of households lack access to broadband, which by itself provides a bright view of the county’s digital opportunity. But our dashboard shows that 97% of the county aren’t using the internet at broadband speeds. Furthermore, more than a third of households don’t have a desktop or laptop to use the broadband available to them.
The dashboard also confirms what we have long known: the digital divide isn’t just felt in rural areas – it also deeply impacts cities. In Los Angeles County, where we’re working with partner Starry to expand access to affordable broadband, more than a quarter of residents aren’t using the internet at broadband speeds, and roughly one in five households lacks a desktop or laptop computer, cutting off millions from the digital world.
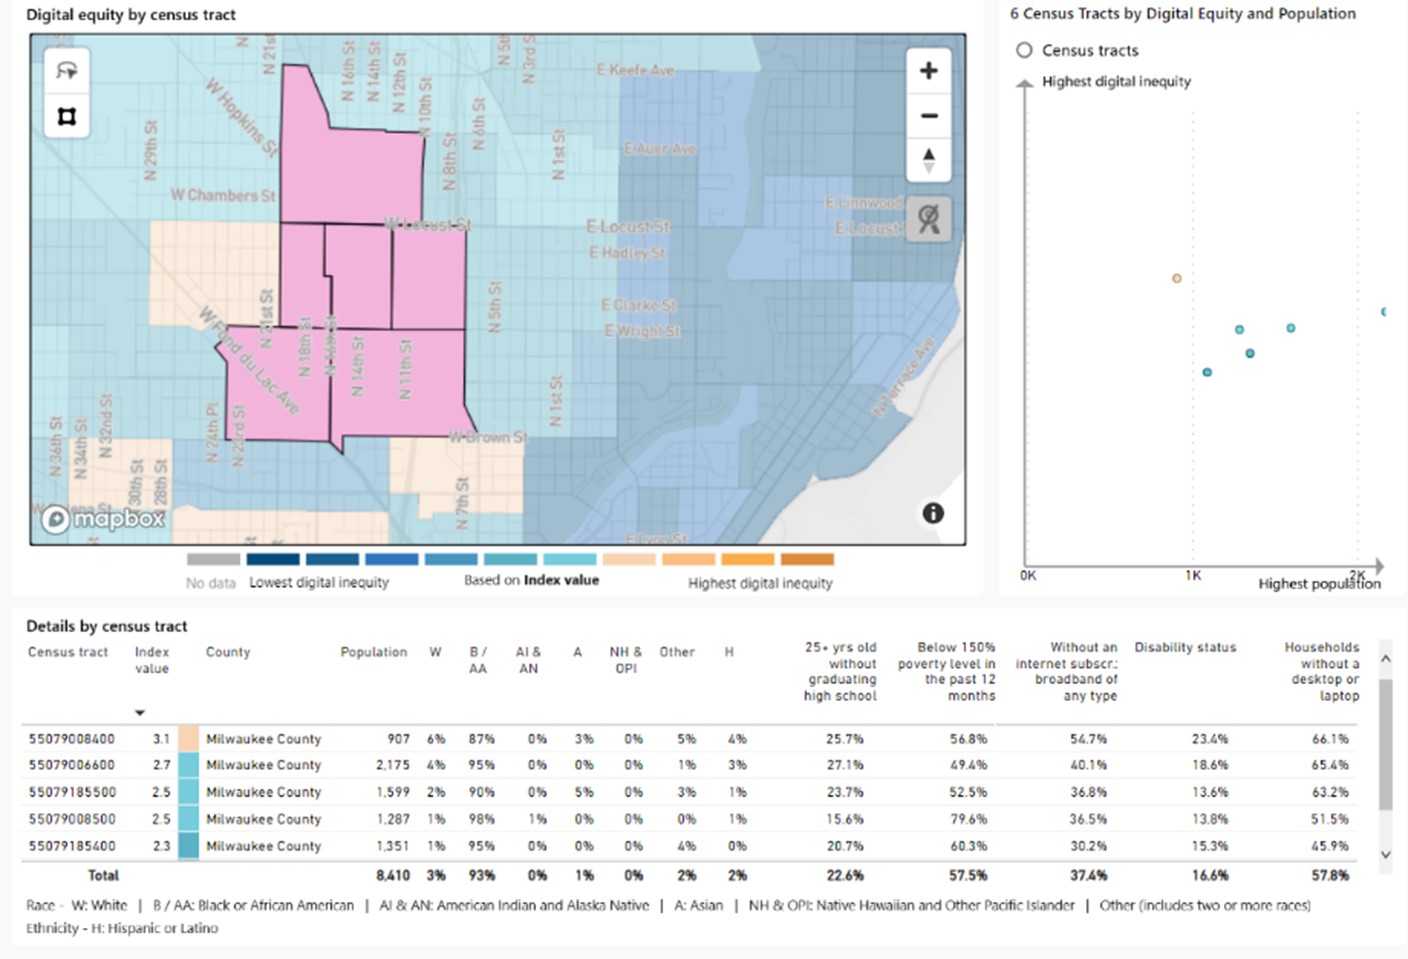
The dashboard offers the opportunity to examine a city neighborhood-by-neighborhood, helping identify which areas most urgently need digital equity investments. Take my old neighborhood of Lindsay Heights in Milwaukee, Wis., for example, where as much as 65%, almost two-thirds, of households don’t have a desktop or laptop, and more than 50% don’t have a broadband subscription. Yet, just to the southeast, only 14% of households don’t have a desktop or laptop and 16% don’t have a broadband connection, a huge difference in just a few miles. By analyzing and illustrating the data at this deep level, lawmakers can now better identify where to focus time and resources to close these inequity gaps.
At Microsoft, we know technology can change lives, but only if it is available, accessible and affordable. Studies have repeatedly shown that investing in broadband infrastructure results in significant social returns, from new business formation rates to lower unemployment rates. We hope that this dashboard will empower the policymakers to implement programs that foster sustainable and inclusive economic opportunity and deliver on this fundamental need to close the digital divide. It is vital that states use the best data available to make targeted investments that translate into true long-term progress, otherwise more and more people will be left on the wrong side of the digital tracks.


