
Artist Dolores Slowinski grew up in the 1950s on Detroit’s Westside. During her childhood and in subsequent conversations with people she met, she remembered hearing that West Warren was a marker of racial divide, with Black families living north of West Warren and Polish families living south of it. In 2016, Slowinski received an invitation from graphic artist/printmaker, Ryan Standfest, to participate in his comic strip inspired collaborative project: Detroit Sequential, which later became an exhibition hosted by Signal Return, a letterpress studio in Detroit. She decided to make a piece that explored the truth of the West Warren myth. She ended up stitching a data visualization.
Her sequential piece, Detroit West Side Patterns, explored the changing demographics and population loss of her neighborhood based on census data. Though Slowinski could locate the information on her own, she did not have the skill to isolate the data she needed. She reached out to Data Driven Detroit (D3) for help. D3 is a data intermediary that provides accessible high-quality information and analysis. D3 Data Analyst Ayana Rubio helped Slowinski identify the data she needed to bring her vision to life.
Slowinski chose to highlight census data from 1950, 1960, 1980, and 2000 to show how the neighborhood changed during her lifetime.
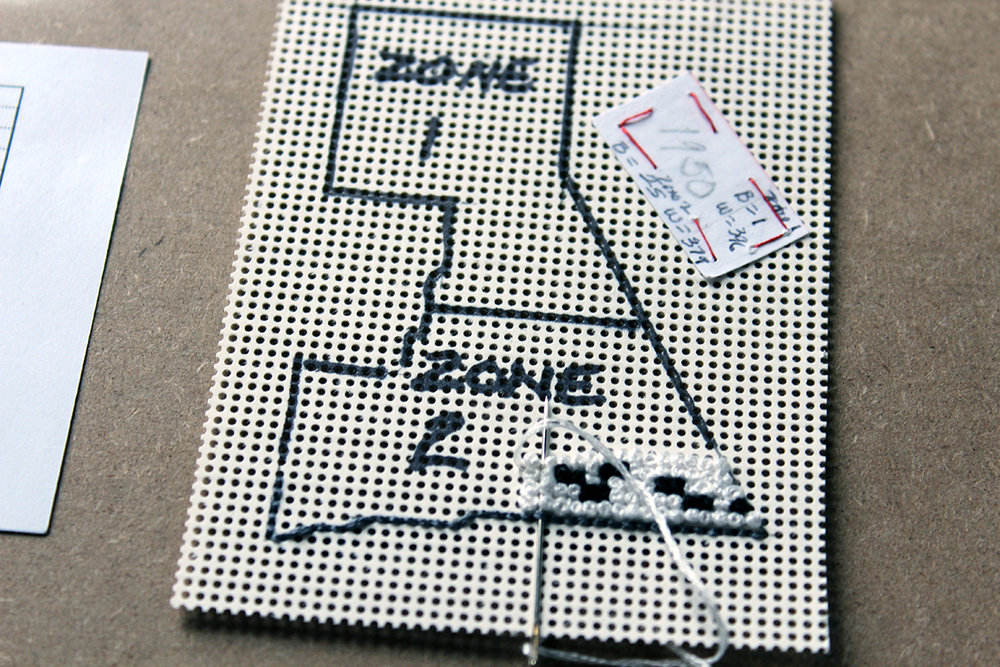
“I made black French knots for the black populace; white French knots for the white populace; and used grey cross-stitches for the lost populace. I had to count the knots carefully, to try to be as accurate as possible,” she said of her piece. “The title alludes to the two ‘zones’ I designated on Detroit’s west side; ‘patterns’ alludes to not only the shifting racial demographic but also to the idea of cross-stitch patterns.”
 Slowinski integrated geospatial and census data into her piece: “I reduced a map… to fit inside a 4 in x 4 in square. I transferred the outline of the map to perforated cross-stitch paper. I translated the percentage of black and white residents of the total population of each zone to the percentage of holes in the cross-stitch paper…a lot of simple math calculations. I worked with census data provided by Data Driven Detroit from 1950, 1960, 1980, and 2000…each decade in one of the 4 squares.”
In the 1950s, Slowinski was told that north of West Warren was a black neighborhood, and south was white. However, census data from 1950 reveals that there were actually more black families living south of West Warren at that time. The 1960s census data reveals that, while the area north of West Warren was becoming much more diverse, the population was still majority white.
“I come from a family of makers. This was my way of both exploring my family’s mythology and dispelling it, visually and by hand,” said Slowinski of her piece.
Detroit West Side Patterns also highlights how dramatic the demographic shift was in this neighborhood between 1960 and 1980. As Detroiters new and old work to understand the city’s complicated past, this data visualization stitches together the story of a neighborhood that changed. Slowinski’s piece invites viewers not only to explore her own lived experience, but to ask why this shift occurred in a larger context.

Her work also reveals the change in population between 1980 and 2000. This highlights population loss even increasing well after the 1967 rebellion. Slowinski was able to examine the accuracy of her lived experience through exploring census data.
“Obviously, mine is not a scientific representation by any means, but rather my impression of what happened based on my experience and conversations and made clearer by the data,” said Slowinski, reflecting on her piece.
Learning to work with data helped Slowinski separate the familial from fact. She describes her previous work as more organic and says that data helped her to develop a more informed concrete end-piece. She plans to continue working with data; for her next project, Slowinski will explore the impact Catholic school closings had on the Detroit education eco-system. She is working with Loveland Technologies to obtain this data, as well as information on the closing of public and charter schools in the city.